Big data visualization screen: grasp the future trend and understand business opportunities
Published on: September 21, 2023 Author: curious numbers
In the era of big data, information is growing explosively. How to quickly and accurately obtain valuable information and make decisions? As a powerful information display and interaction tool, big data visualization screen is gradually becoming an essential tool for enterprises and decision-makers. This article will discuss the application value and advantages of the big data visualization screen, and how to select the appropriate visualization tools.
I Application value of big data visualization screen
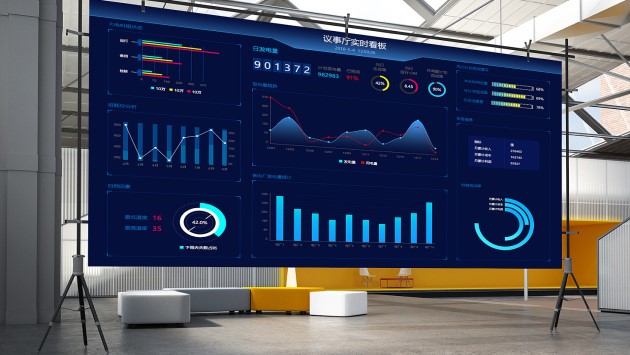
Improve decision-making efficiency: by displaying data on an intuitive and vivid large visual screen, decision-makers can quickly understand the data overview and grasp key information, thus improving decision-making efficiency.
Enhance data insight: With the help of rich charts, graphs and animation elements, the big data visualization screen can help enterprises discover the rules, trends and associations hidden in data, and provide data support for business development.
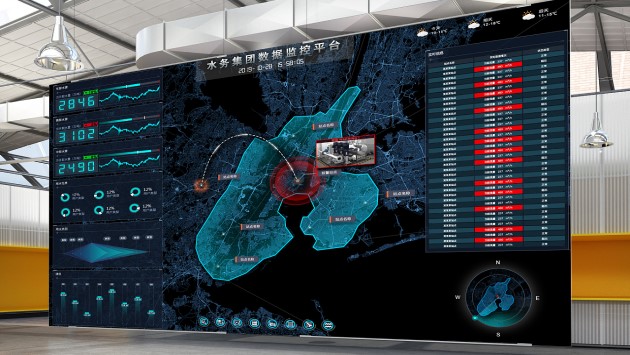
Optimize resource allocation: through real-time monitoring and data display, enterprises can reasonably allocate resources, adjust strategic direction, and make more efficient use of resources.
Enhance the corporate image: a beautiful and professional large visual screen display can enhance the corporate professional image and highlight the brand strength.
II Advantages of big data visualization screen
Strong interactivity: the large visual screen supports multiple interactive methods, such as clicking, dragging, zooming, etc., and users can quickly locate the data points of interest.
Real time update: The big data visualization screen supports real-time data update, which can keep abreast of the latest data trends and provide instant information for decision-making.
Strong customizability: according to business requirements and data characteristics, large visualization screens can be customized and developed to improve the pertinence of data display.
Multi dimensional analysis: supports multi-dimensional and multi angle analysis of data to help enterprises discover deeper data associations and laws.
III How to select appropriate big data visualization tools
Consider data size: select visualization tools that can handle large-scale data according to the size and complexity of enterprise data.
Combined with business requirements: according to the business characteristics and development needs of the enterprise, select visualization tools that meet the industry characteristics.
Ease of use evaluation: choose visual tools that are easy to operate and use to reduce learning costs.
Compatibility review: consider the compatibility of visualization tools with other systems to ensure the smoothness of data interaction and sharing.
Customizability evaluation: select visualization tools that support customized functions and appearances to meet the specific needs of the enterprise.
Support real-time data update: select visualization tools that support real-time data update to ensure the timeliness and accuracy of data.
Consider data security: select reliable data encryption and powerful visualization tools with security protection functions to ensure enterprise data security.
In short, as an important information display tool for modern enterprises, the big data visualization screen has many application values, such as improving decision-making efficiency, enhancing data insight, optimizing resource allocation, etc. When selecting appropriate visualization tools, enterprises need to fully consider the factors such as data size, business requirements, ease of use, compatibility, customizability, real-time data update, and data security. Only by selecting appropriate visualization tools can the value of big data be brought into full play and more business opportunities and development impetus be created for enterprises.